EventTranscript.db contains many events of varying interest to DFIR examiners. Some of the most forensically relevant Event Names explored by Kroll were prefaced with Win32kTraceLogging.
Within Win32kTraceLogging events, the following Event Names emerged:
- Win32kTraceLogging.AppInteractivity
- Win32kTraceLogging.AppInteractivityDP
- Win32kTraceLogging.AppInteractivityDPDiag
- Win32kTraceLogging.AppInteractivitySummary
- Win32kTraceLogging.GdiScreenAccess
- Win32kTraceLogging.PossibleHotkey
- Win32kTraceLogging.PostUpdateUseInfo
- Win32kTraceLogging.RotationManager_AutoRotationState
- Win32kTraceLogging.SynchronizedWindowResize
- Win32kTraceLogging.Win32ProcDPIAwareness
Research has not been conducted on most of these events yet, but Kroll identified the most forensically interesting as Win32kTraceLogging.AppInteractivitySummary and Win32kTraceLogging.AppInteractivity. Kroll observed these events as a means to serve as another evidence-of-execution artifact similar to common artifacts including but not limited to Amcache, Prefetch and UserAssist.
Part of Kroll’s testing and investigative analysis to date has comprised a range of tools, including system applications that dictate the behavior of User Account Controls and the execution of applications with elevated permissions.
We focused control testing on running tools, commonly found during incident response investigations as having been left behind or prior executed by a threat actor. Those tools include normal freeware consisting of any of the following as examples: 7-Zip, Advanced IP Scanner, MegaSync, PsExec, ProcDump and ChromePass.
From these tools, all the way through running a known malicious executable such as size.exe (VirusTotal/JoeSandbox Report), Kroll observed this event recorded the SHA1 value of the executable twice within the JSON payload.
Win32kTraceLogging.AppInteractivitySummary
Win32kTraceLogging.AppInteractivitySummary is part of the Product and Service Usage data recorded by Windows 10. According to Microsoft, the event:
“Summarizes which app windows are being used (for example, have focus) to help Microsoft improve compatibility and user experience. Also helps organizations (by using desktop analytics) to understand and improve application reliability on managed devices.”
Kroll observed this event being recorded upon an application being closed. As such, it serves as an evidence-of-execution artifact but at the opposite end of the spectrum from artifacts such as Amcache, Prefetch and UserAssist. The benefit this event provides over the others is the focus time in milliseconds that the user had an application as the topmost window on their monitor. Microsoft appears to track this event from a specific period in time (AggregationStartTime); Kroll has yet to understand fully why this time is chosen. Kroll has observed this AggregationStartTime timestamp to be anywhere from twenty (20) minutes to twenty-four (24) hours prior to this event being recorded.
Win32kTraceLogging.AppInteractivity
Win32kTraceLogging.AppInteractivity is part of the Product and Service Usage data recorded by Windows 10. There is currently no official documentation from Microsoft on this event, but it appears to be only visible when data sampling is enabled on a user’s system. This particular event will be recorded every time an application comes into focus. The examiner will be able to see for how many milliseconds the application was in focus before another application was moved into focus, to which another event would be recorded for that next application and so on.
Without data sampling, simply the Win32kTraceLogging.AppInteractivitySummary event will be recorded when an application is closed and a summary of all Win32kTraceLogging.AppInteractivity events will be recorded into one Win32kTraceLogging.AppInteractivitySummary event.
Regardless of which level of visibility you have on these events due to data sampling (research ongoing), you will still be able to obtain some valuable quick wins that will make these events another source of reliable evidence of execution.
Quick Win 1: SHA1 Hash of Binary … Twice!
Kroll observed within both Win32kTraceLogging.AppInteractivity and Win32kTraceLogging.AppInteractivitySummary that the SHA1 value of the binary being recorded in the event is recorded twice (Figure 1).
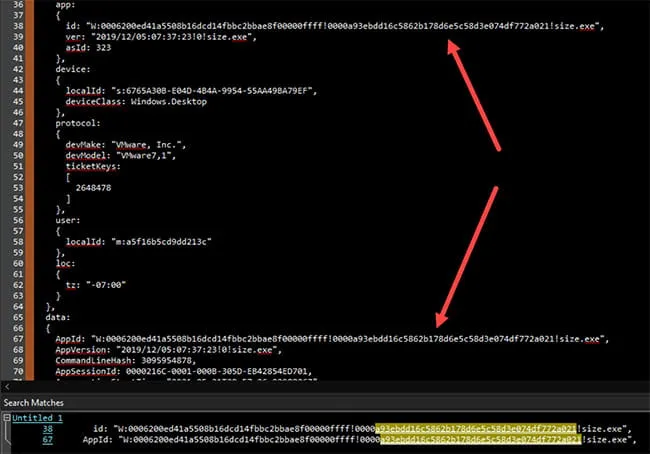
Figure 1: SHA1 Value of Binary Recorded Twice
It should be noted that Microsoft logs the SHA1 in similar fashion to the way SHA1 values are recorded in the Amcache. Within the Amcache, four (4) zero (0) values precede the SHA1 value of the binary. Kroll observed this same structure within both Win32kTraceLogging.AppInteractivity events.
Quick Win 2: Timestamp Comparison
Kroll performed a comparison of the timestamp recorded in the Win32kTraceLogging.AppInteractivitySummary event with other commonly used artifacts related to evidence of execution, such as Amcache, Prefetch, UserAssist, Sysmon Event 1 and MFT (LastAccess0x10). Kroll observed no more than a four-second delta between the earliest timestamp recorded (Prefetch) and the latest timestamp recorded (MFT Last Access 0x10 and Sysmon Event 1) for size.exe (Table 1).
| Timestamp | Artifact | Timestamp Name/Description |
| 2021-05-21 21:07:06 | Prefetch | RunTime |
| 2021-05-21 21:07:07 | UserAssist | Last Executed |
| 2021-05-21 21:07:09 | Amcache | Last Executed |
| 2021-05-21 21:07:10 | Win32kTraceLogging.AppInteractivitySummary | Timestamp |
| 2021-05-21 21:07:10 | Sysmon Event 1 | Process Creation |
| 2021-05-21 21:07:10 | MFT | Last Access 0x10 |
Table 1: Win32kTraceLogging Timestamp Comparison with Common Artifacts
It should be noted that with size.exe being executed, it was opened and closed almost instantly, which makes the Win32kTraceLogging.AppInteractivitySummary timestamp serve as evidence of execution. This behavior is commonly exhibited by malicious software utilizing execution redirection as an evasion technique. Kroll assesses that for malicious binaries that execute in this similar manner, the Win32kTraceLogging.AppInteractivitySummary event will serve in a similar manner as Amcache, Prefetch and UserAssist. Regardless, if a malicious binary is executed and then not closed instantly, this application will still be recorded upon application close, and the SHA1 value of the binary and how long the application was in focus will be recorded, which we will cover in the next section.
Quick Win 3: InFocusDurationMS
Additionally, this artifact provides a value titled, InFocusDurationMS, which provides an examiner with the duration the end user had an application as the topmost window during an active user session.
For example, Diagnostic Data Viewer was already running in our testing environment, and we brought it into focus, where we observed a Win32kTraceLogging.AppInteractivity event was recorded (Figures 2–5).
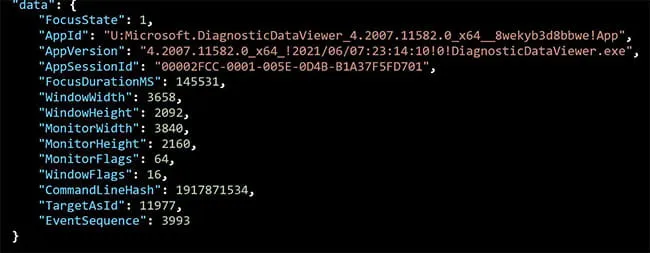
Figure 2: Diagnostic Data Viewer Opened (Win32kTraceLogging.AppInteractivity)
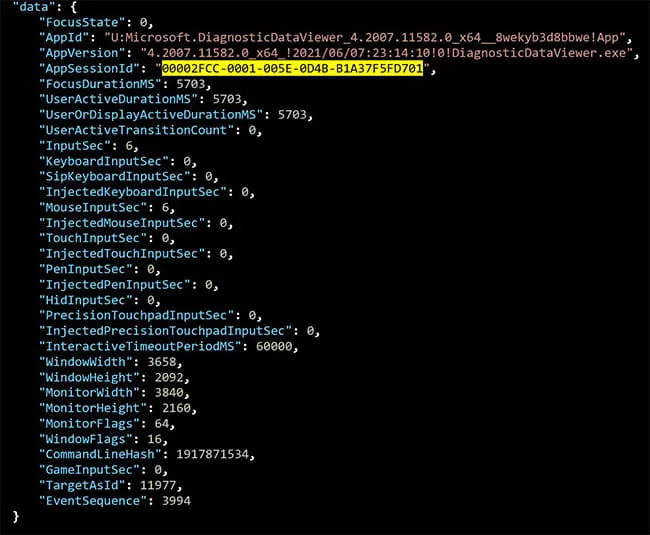
Figure 3: Diagnostic Data Viewer Brought Out of Focus (Win32kTraceLogging.AppInteractivity)
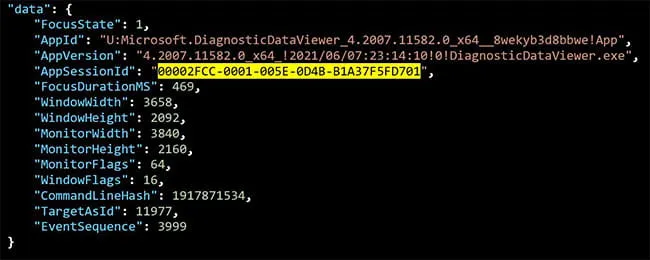
Figure 4: Diagnostic Data Viewer Brought in Focus (Win32kTraceLogging.AppInteractivity)
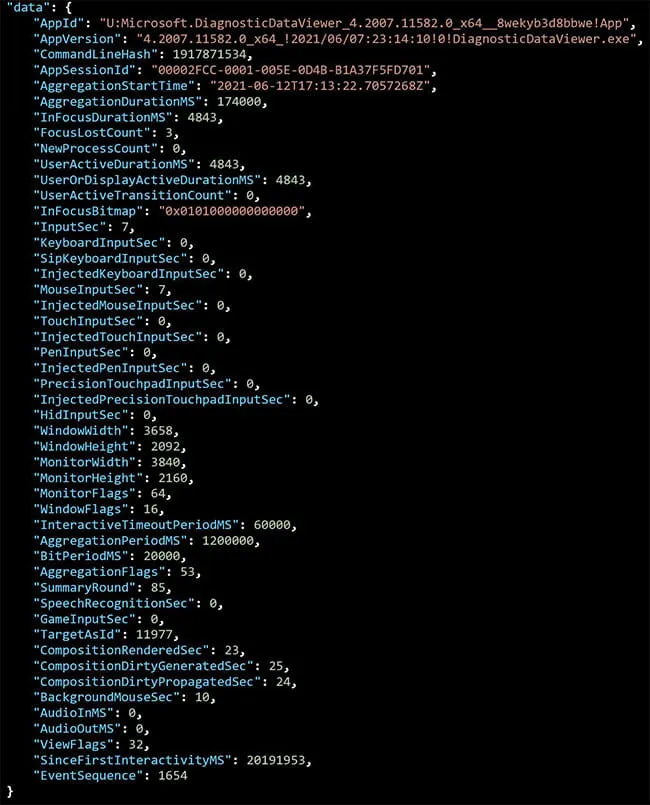
Figure 5: Diagnostic Data Viewer Closed (Win32kTraceLogging.AppInteractivitySummary)
This artifact and related reference points can serve as a reliable evidence-of-execution artifact that forensic examiners can leverage to demonstrate the date and time for program execution.
In summary, Kroll sees the Win32kTraceLogging Event Names to be forensically relevant moving forward. EventTranscript.db survives anti-forensic tactics such as event log clearing or encrypting/deleting user data.
Win32kTraceLogging events also track the SHA1 of the binary for the application being used by the user. While no apparent user attribution is logged within this event, correlation of data with other artifacts such as UserAssist or RDP/user sessions can correlate activity with a user account. Further research is needed to better understand the Win32kTraceLogging Event Names, not covered in this blog post, to better understand their forensic relevance, if any.

