Diagnostic Data Viewer can be used to navigate the contents of EventTranscript.db with ease. When using the GUI of Diagnostic Data Viewer rather than CSV output or otherwise from another tool, certain tactics help find activity associated with a user or application’s session. Windows 10 appears to assign a GUID to a user, a process and an application’s session. DFIR examiners can pivot on these GUIDs to find associated activity with the user, process or application.
For this demonstration, we’ll use the Event name: Microsoft.Office.SessionIdProvider.OfficeProcessSessionStart. This Event name indicates the execution of an Office application on the user’s system, and once this event is generated, certain information is captured within the JSON payload (Figure 1).
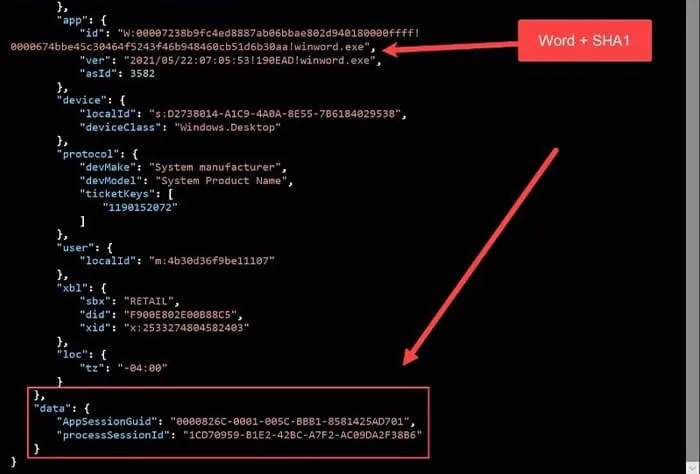
Figure 1: OfficeProcessSessionStart Information in JSON Payload

Figure 2: AppSessionGuid Value
Examiners can pivot on the AppSessionGuid by copying the value provided (Figure 2) into the search box within Diagnostic Data Viewer and observing the activity logged by Diagnostic Data Viewer that is associated with that application’s session. For instance, Kroll tested this by opening Microsoft Word for a few seconds, putting Word out of focus, cycling through other open applications, circling back to Word, cycled back to other applications, typed “test”, brought other applications into focus, then closed Word without saving (Figure 3).
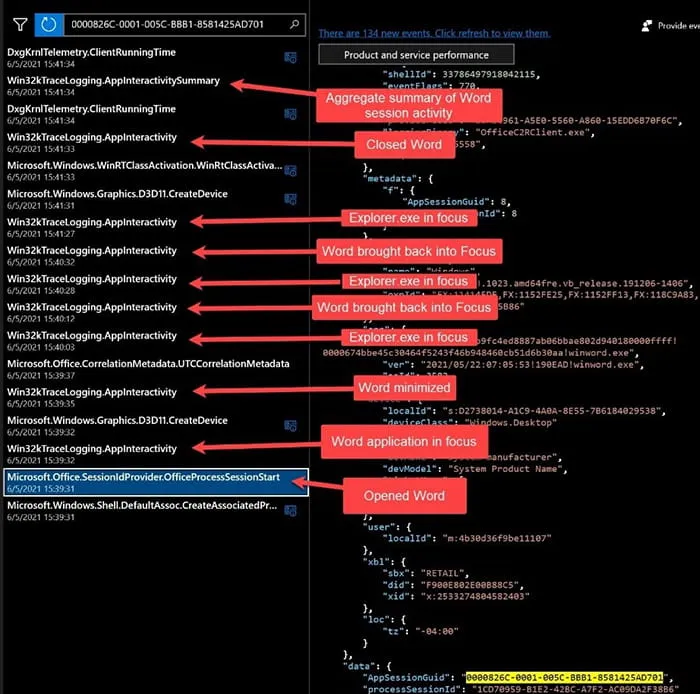
Figure 3: Test Using Word Application
Please note, it is currently unknown why Explorer.exe was being logged as associated with this application’s session GUID and not others as other third-party applications were brought into focus during this exercise. The main takeaway here is that the AppSessionGUID can be used to find other associated activity with an application’s active user session.
Moving on to the processSessionId, we carried out the same process as before to see what other activity occurred surrounding the winword.exe process’s session (Figure 4).
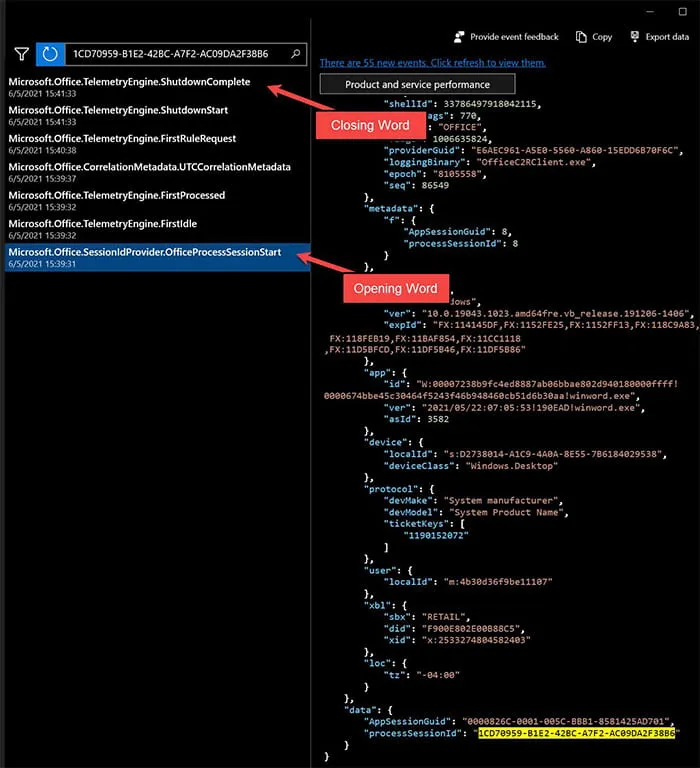
Figure 4: Test processSessionId Activity
The timestamps in Figure 4 can be correlated with activity in Figure 3 relating to the Microsoft.Office.SessionIdProvider.OfficeProcessSessionStart event.
Note that above the selected Microsoft.Office.SessionIdProvider.OfficeProcessSessionStart event is an event called Microsoft.Office.TelemetryEngine.FirstIdle (Figure 5).
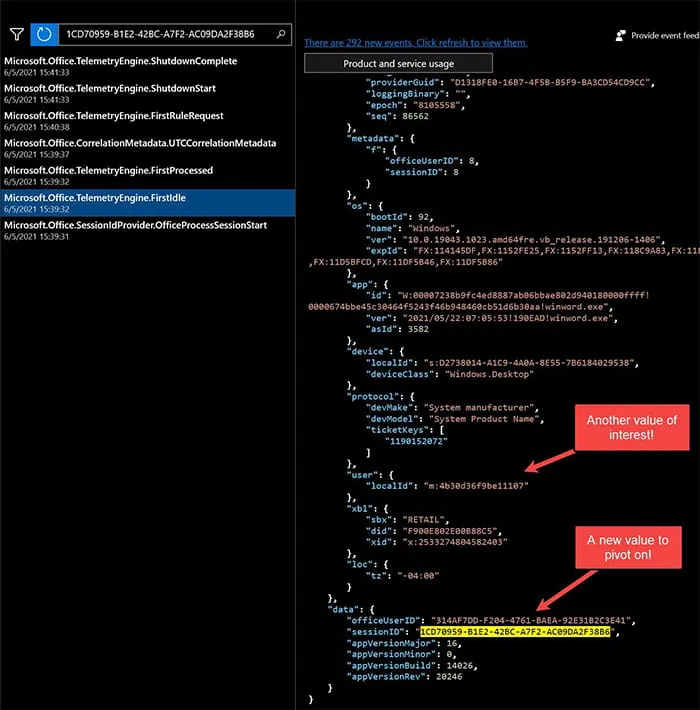
Figure 5: Microsoft.Office.TelemetryEngine.FirstIdle
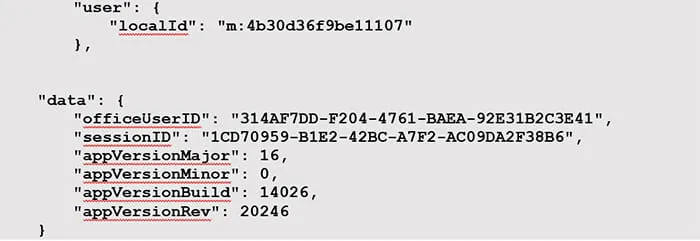
Figure 6: processSessionID Value
Upon initial inspection, the processSessionID value is labeled sessionID (Figure 6). However, above that sessionID value is a new value titled, officeUserID. Additionally, above that there is another value titled, localId. This serves as another value examiners can pivot on to locate more associated activity. Pivoting on the localId reveals a potential treasure trove of data that could be leveraged in an investigation (Figure 7).
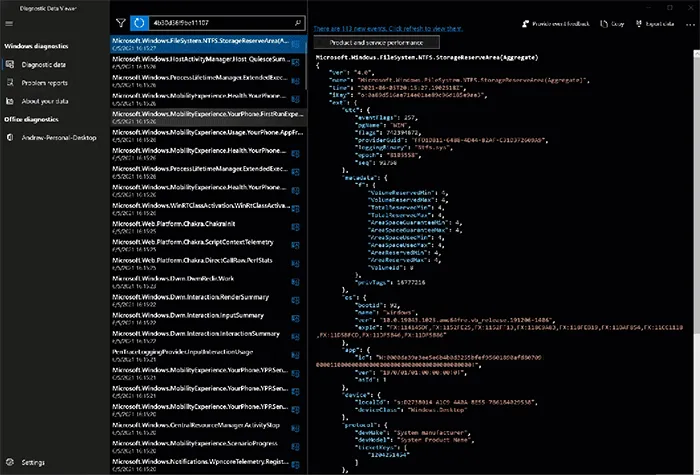
Figure 7: Filtering on localId Value in Diagnostic Data Viewer
The same goes for officeUserID — pivoting on this value could lead to potentially interesting data related to user activity (Figure 8).
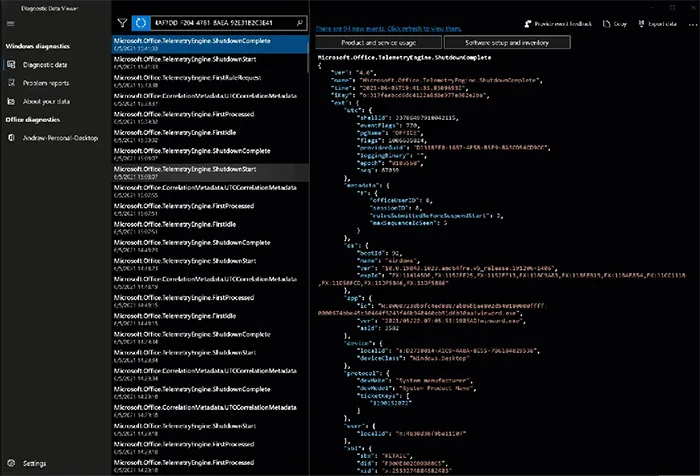
Figure 8: Filtering on officeUserID in Diagnostic Data Viewer
These are just a few examples of how DFIR examiners can use various data points within the JSON payloads of events in EventTranscript.db using Diagnostic Data Viewer to find potential data of interest. However, Diagnostic Data Viewer does not currently allow one to ingest an external database of events. Diagnostic Data Viewer can be used only for the system it is installed on. Kroll provides a workaround to this by using KAPE to extract and parse this artifact into a CSV that an examiner can ingest into Timeline Explorer for analysis. See our article detailing this process here.

