EventTranscript.db can be parsed with PowerShell. To interact with the service and retrieve the database contents, you need to install the Microsoft.DiagnosticsDataViewer PowerShell module as outlined by Microsoft here. Additionally, the module is also available at PSGallery here.
Usage of the PowerShell module is straightforward but suffers from minor issues. The module allows for control of the logging capabilities provided by the DiagTrack service. However, it requires installation of the Diagnostic Data Viewer application from the Microsoft Store. Once that is installed, diagnostic data viewing can be enabled via the Enable-DiagnosticDataViewing cmdlet (Figure 1).

Figure 1: “Enable-DiagnosticDataViewing” Cmdlet
Viewing the various categories of diagnostic data is accomplished by using the Get-DiagnosticDataCategories cmdlet. The documentation at (https://docs.microsoft.com/en-us/powershell/module/microsoft.diagnosticdataviewer/?view=windowsserver2019-ps) lists the cmdlet as Get-DiagnosticDataTypes. As shown in Figure 2, this is incorrect.
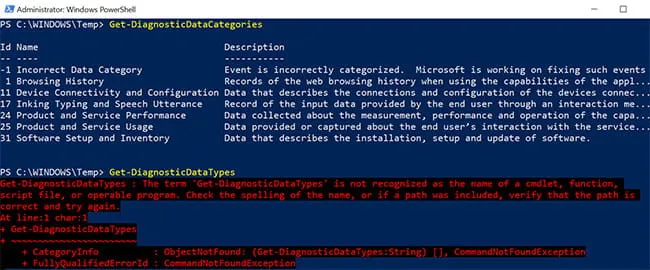
Figure 2: Enumeration of Data Collection Types
Next, we can extract various diagnostic data and apply filters. The output is typically provided as JSON (Figure 3), but we can also export the data as a CSV.
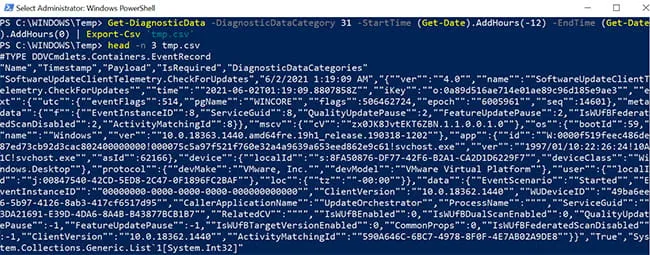
Figure 3: JSON Output
Enhanced Logging
Enhanced logging of telemetry data provided by the DiagTrack service is enabled by selecting the Optional diagnostic data option from the Diagnostics and feedback section in Windows Settings (Figure 4). However, on several systems where we tested the logging functionality of the DiagTrack service, the Optional diagnostic data option was greyed out in the GUI.
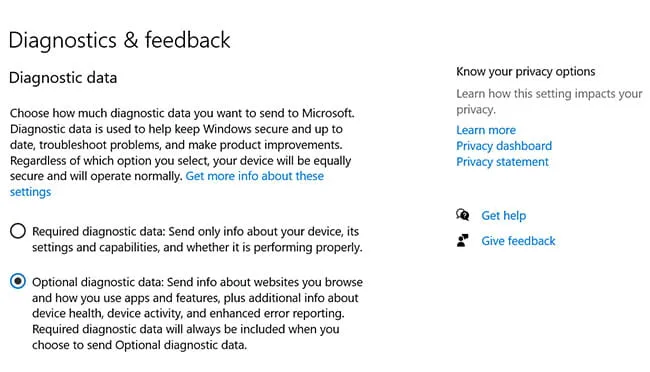
Figure 4:“Optional diagnostic data” Option
To manually enable the additional logging capabilities of the service, we can modify the following registry keys to contain a DWORD value of 0x00000003. This value correlates to the Optional diagnostic data setting as shown above.

Figure 5: Registry Settings
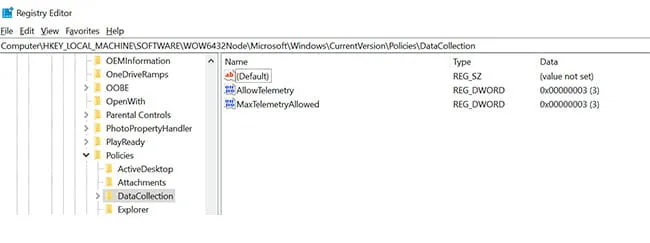
Figure 6: Registry Location
Once it is enabled, we can toggle the optional data collection categories.

Figure 7: Optional Data Collection Selection
Optional data collection enables us to record web traffic visited by Internet Explorer and Microsoft Edge. The telemetry collection appears to be enabled via the Aria telemetry collection packages. Settings for these packages can be found under the registry keys (Figure 8).

Figure 8: Settings for Aria Telemetry Collection Packages
Unfortunately, web traffic from Firefox and Google Chrome does not appear to be collected. However, we can determine partial URL and navigation time from the navigationUrlBytes and time fields of the Browser History diagnostic data category. As shown in Figure 9, the navigationUrlBytes field contains the value 0x646F67732E676F6F676C652E636F6D. Decoded to text, this field contains the domain name and top-level domain (TLD) values google.com.
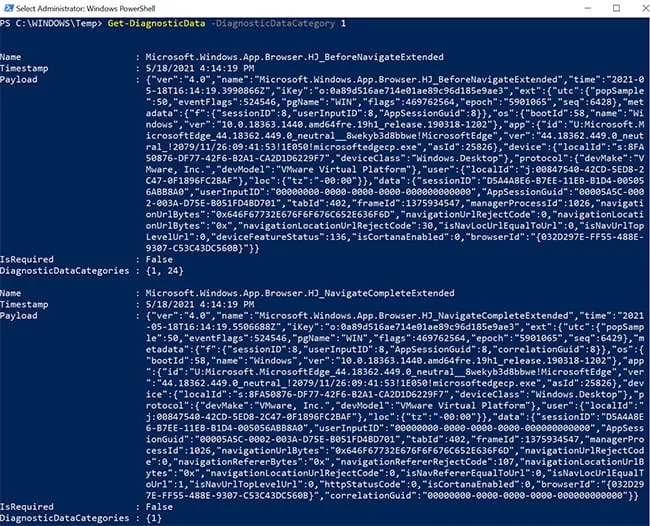
Figure 9: “navigationUrlBytes” Field

